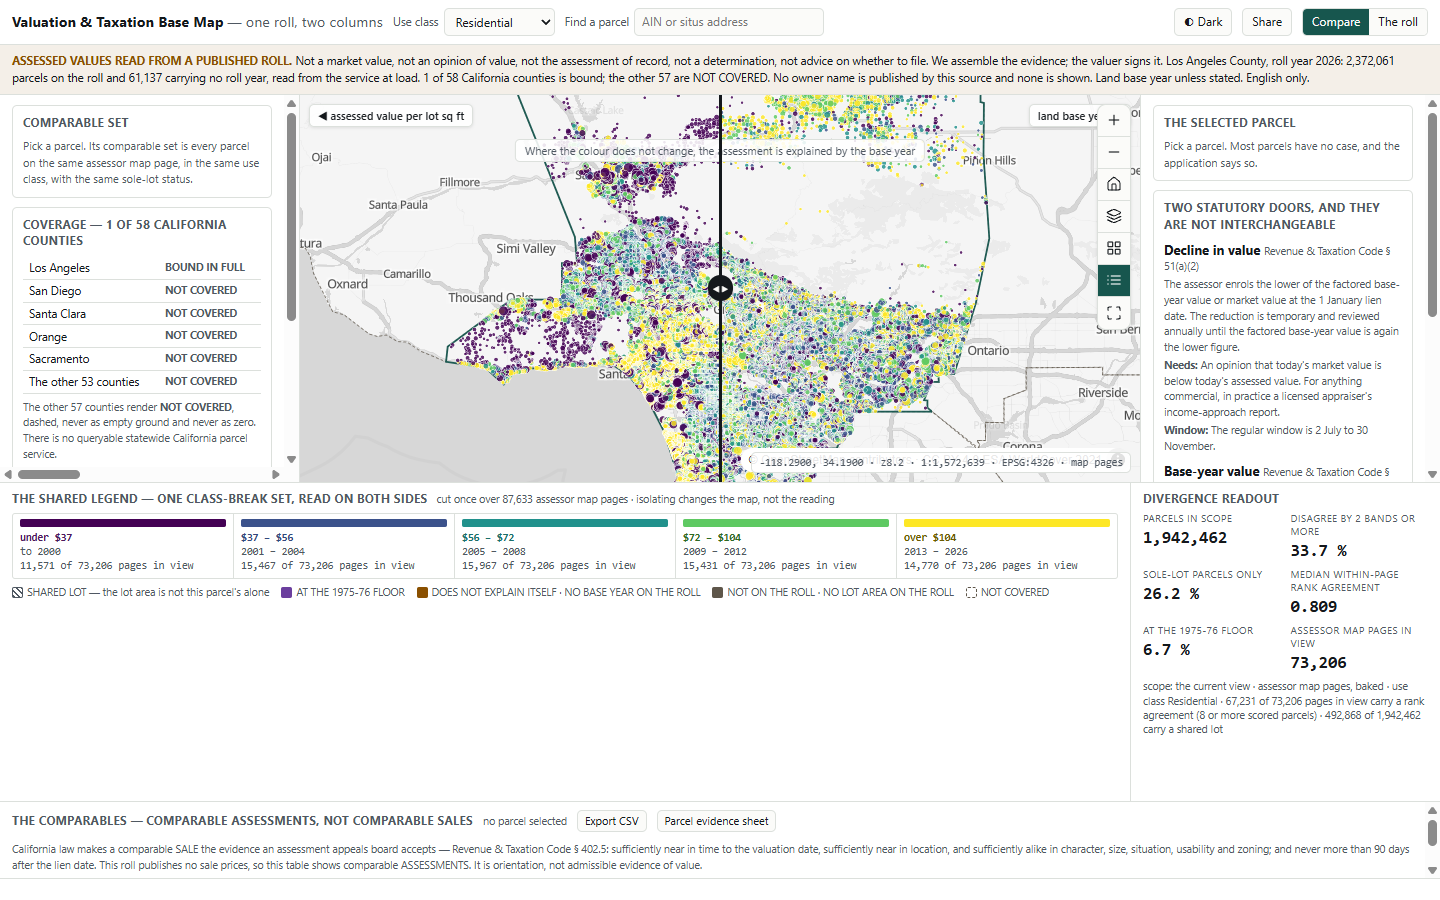
A map of the official assessment roll. Slide a divider across the same parcels. One side shows assessed value per square foot of land. The other shows the year the land was last reassessed. Both use the same five colours, so where the colour stays the same, the purchase year explains the assessment.
Before an owner decides to appeal, they need to know which kind of appeal applies. California has two. Each needs different evidence and has a different deadline.
An appeal costs a $46 filing fee and must be lodged within a fixed window. For commercial property, the appraiser's report usually costs far more than both. For most owners the honest answer is don't file, and the app shows why using the county's own figures. For the rest, it shows which question is worth paying an expert to answer.
Most owners would gain nothing from a decline-in-value appeal. A tool that shows this from the county's own data saves them time and fees.
Assessors buy record-keeping systems. Owners can hire appeal firms that take a share of any savings. Few tools let owners check the numbers themselves.
Proposition 13 is California's 1978 limit on property tax. A property is assessed at its 1975-76 value, or at its value when it was last bought or newly built. After that, the assessed value can rise by no more than 2 % a year. So two identical houses can carry very different assessments because they were bought in different years.
In Nordlinger v. Hahn (1992), an owner taxed about five times more than her neighbours challenged this rule. The US Supreme Court upheld it, 8 to 1. Large gaps between neighbours are what the law intends.
It shows how much of a gap comes from the purchase year. A gap caused by purchase year cannot be appealed. A gap the purchase year does not explain may deserve a closer look. The court ruling is quoted on each parcel's card.
The useful question becomes: is my assessment high for a reason I can actually challenge?
| Route | The rule | What you need | Deadline |
|---|---|---|---|
| Decline in value "Proposition 8" | The assessed value is the lower of the base-year value (plus the yearly increases) or the market value on 1 January. A reduction is temporary and reviewed each year. (R&TC § 51) | Evidence that today's market value is below today's assessed value. For commercial property this usually means an appraiser's report based on income. | 2 July to 30 November |
| Base-year value | The original base-year value stands unless challenged in the year it was set or the three years after. (R&TC § 80) | Proof that the original base-year value was wrong. A plain factual error, not a matter of opinion on value, can be raised in any year it is found. | Four years, or any time for a factual error |
Under § 402.5, a comparable must be a sale, close in time and place, and no more than 90 days after 1 January. This roll does not publish sale prices.
Its comparables are similar assessments, not sales. A note above the comparables table explains why they cannot be used as evidence of value. The same note appears in every export.
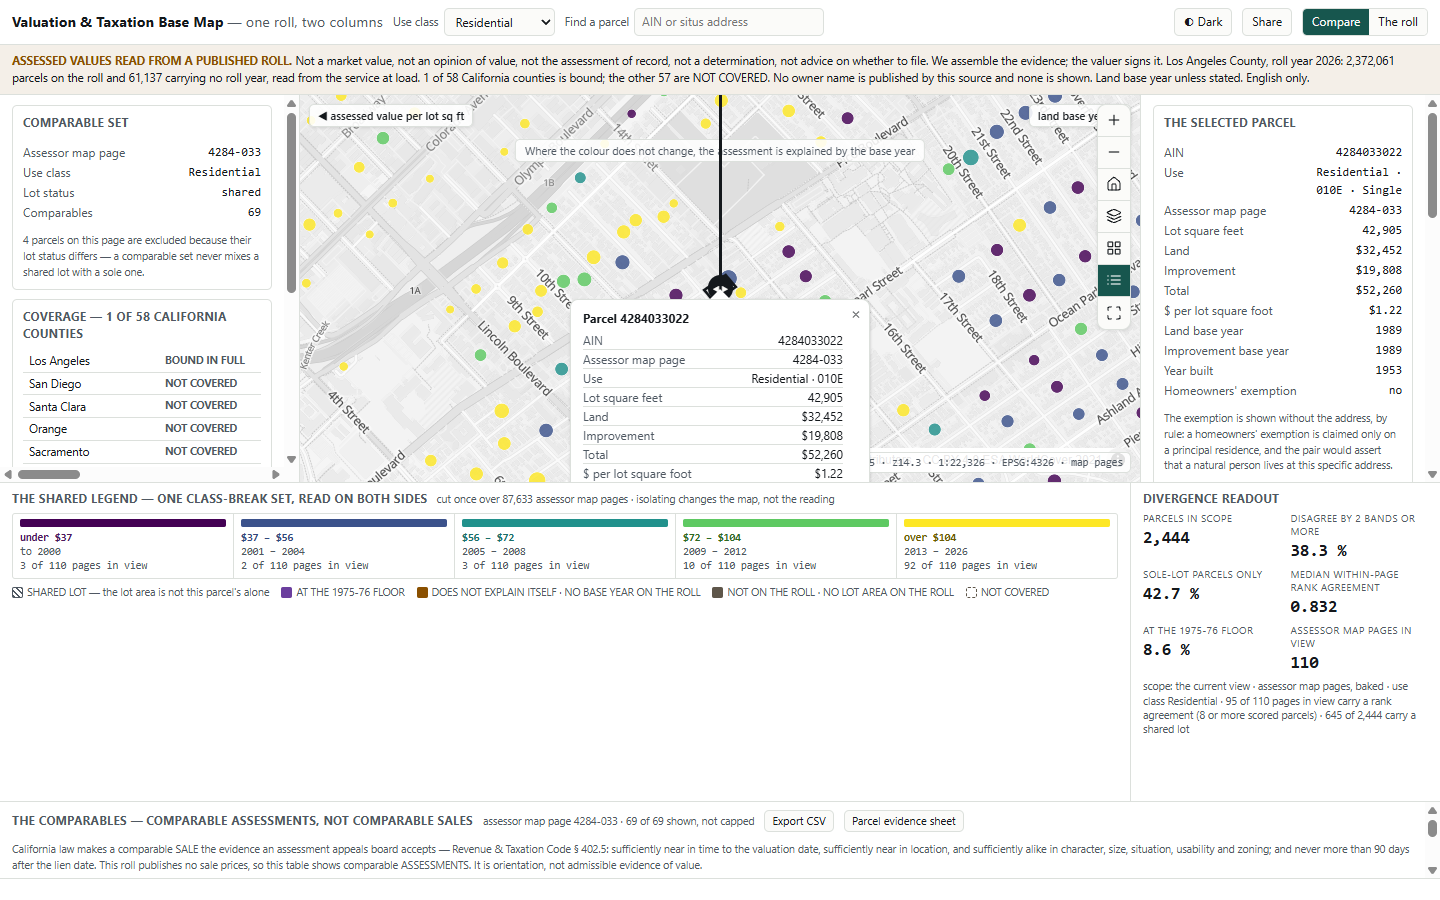
A divider splits the map over the same parcels. On the left, parcels are coloured by assessed value per square foot of land. On the right, by the year the land was last reassessed. Both sides use the same five colour bands, set once for the whole county.
If a parcel keeps its colour as the divider passes over it, its assessment is explained by when it was bought.
The colours stay readable for people with colour blindness, and still work when printed in black and white for an appeal file.
For parcels of the same use on the same block, the app splits the differences in assessed value into two parts: the part that comes from the property, and the part that comes from the purchase year.
In plain terms: on a typical Los Angeles County block, about four fifths of the order in which neighbours are assessed matches the order in which they bought. Two figures are given because in some areas nearly half of homes are units sharing one lot, where a per-lot measure says less.
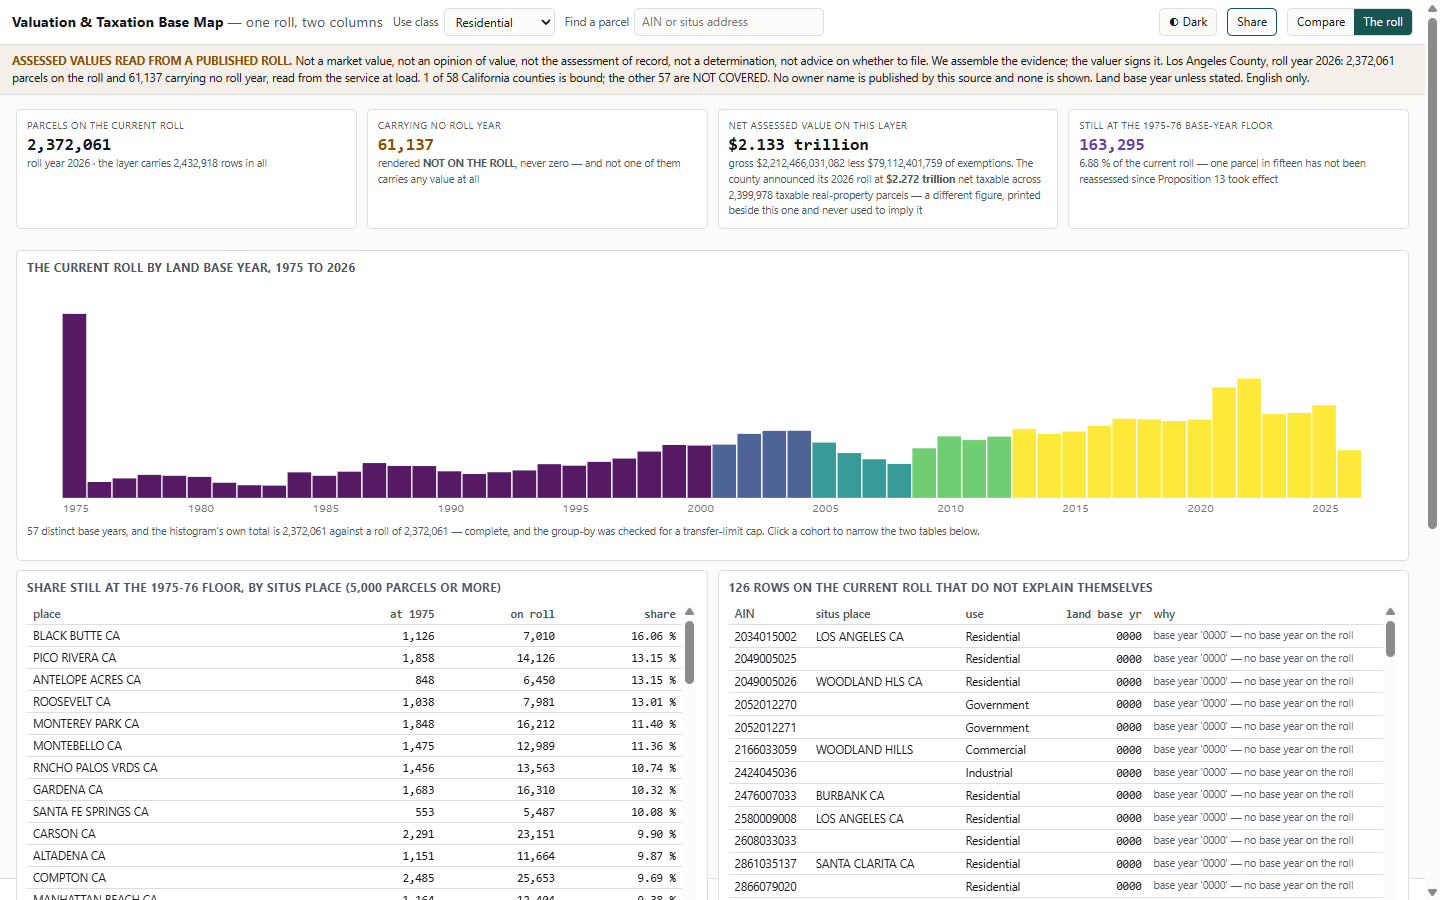
6.89 % of the roll, about one parcel in fifteen, has not been reassessed since Proposition 13 began. The share varies 25-fold across the county, from 16.08 % in one place to 0.63 % in another.
124 show no valid base year ("0000"), 4 show one earlier than 1975, and 1 shows a year after the roll year. Under § 80, a factual base-year error can be raised in any year it is found.
This is where the roll alone may give an owner something to take to the assessor. The app flags these records as worth asking about. It does not claim the roll is wrong.
Every figure comes from the Los Angeles County assessment roll as the county publishes it (2026 roll, read on 7 September 2026). Nothing is estimated or modelled.
Each number shows where it came from and when. Totals are checked against the county's own parcel counts.
The county does not publish owner names, and the app shows none.
The roll has no sale prices, rents or appeal outcomes. Where data is missing, the app leaves the space empty and says why.
Two totals, shown side by side: the app's own net total for the roll is $2.134 trillion. The county announced its 2026 roll at $2.272 trillion across 2,399,978 taxable parcels. Both are quoted as published.
We need a parcel data service that carries an assessed value and a base year, and a note of which appeal routes your jurisdiction allows. In about two weeks, the app reads your area instead of Los Angeles.
The parcel source, the two mapped columns, the colour bands and the legal text are all set up without new code. If you already license sales data, it can be added, and comparable sales then become available.