Health Equity Overlay · Health
Where are health outcomes worse than expected?
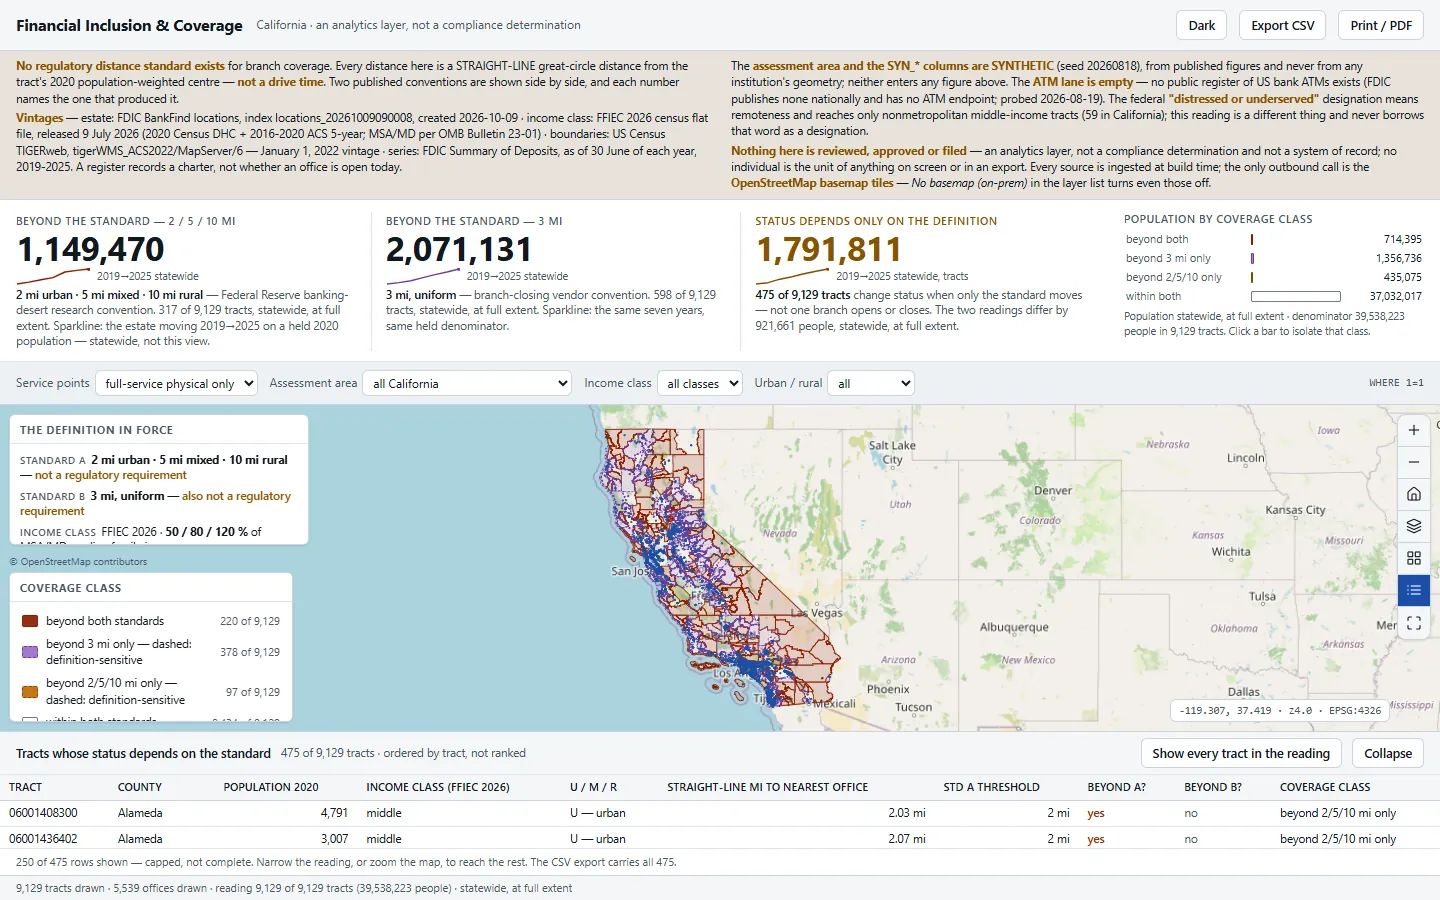
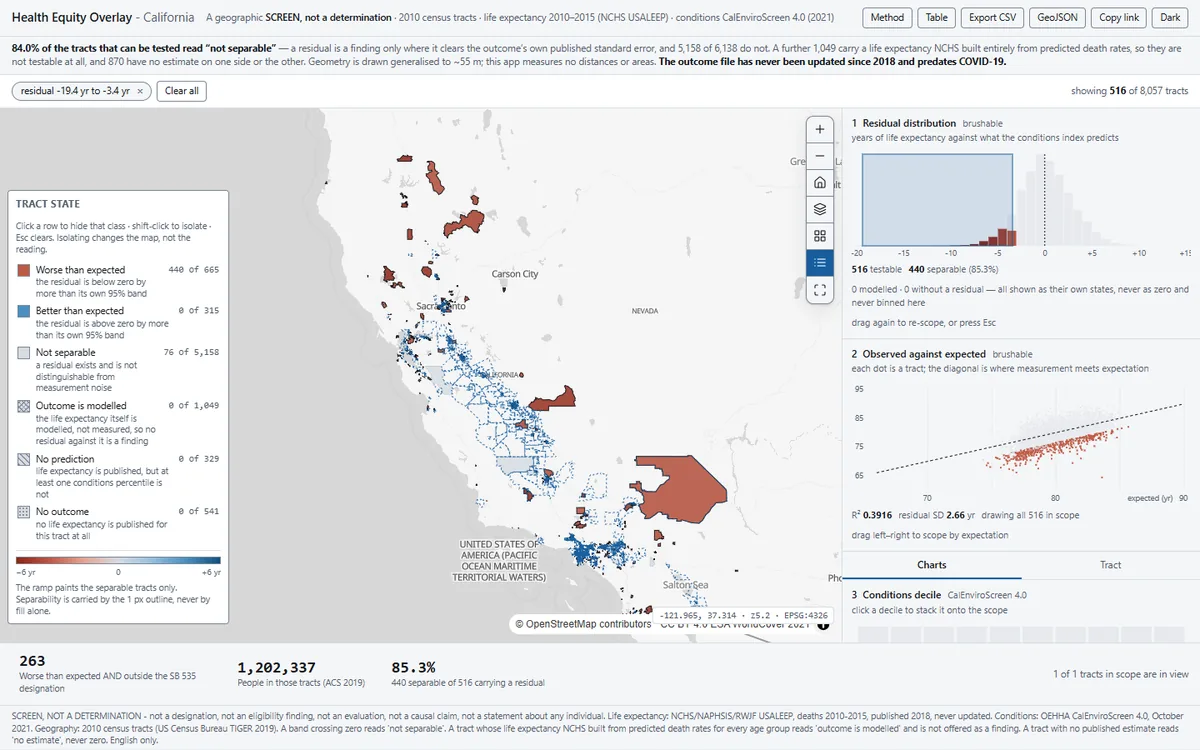
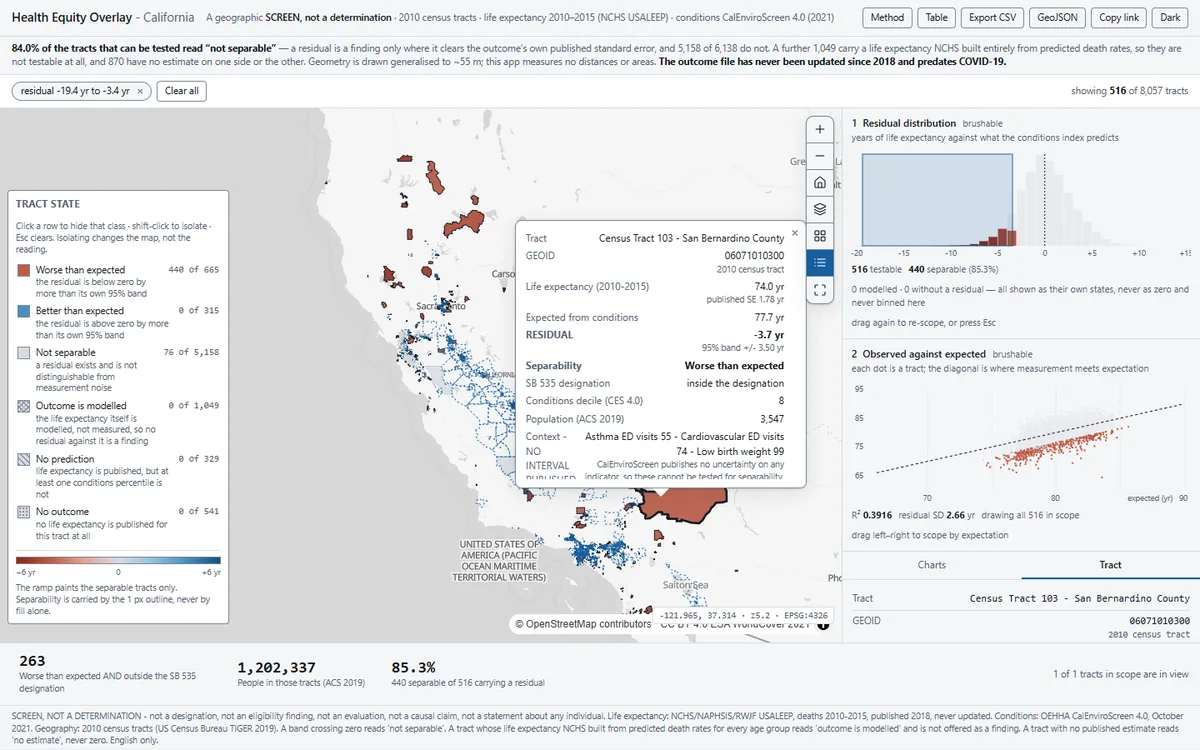
Maps the California tracts where life expectancy is worse than the state's CalEnviroScreen index predicts, and flags only those where the gap exceeds the estimate's own margin of error.
Before you open it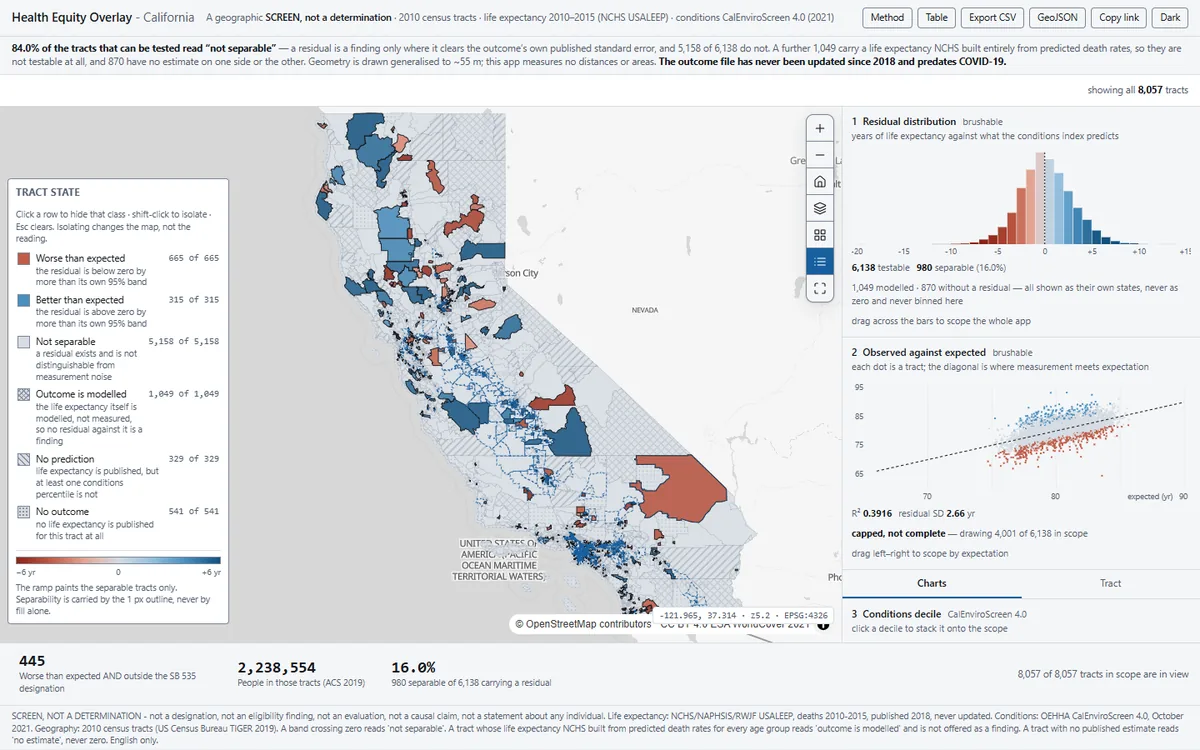 1
 2
 3
What you'll do in the app
1See the headline762 tracts are measurably worse than predicted; 512 of them lie outside the SB 535 designation.
2Brush the gapSelect a band on the chart; the map, the scatter and the designation split follow, and a chip names the band.
3Open a tractIts gap, both inputs, its designation and its vintages: the arithmetic in full.
Demo dataCDC life expectancy and live CalEnviroScreen 4.0
StandardCDC/ATSDR SVI
Runs onStrata, or your existing Esri services
Built fromAn open recipe, in one run with Claude
On your own data
Want this on your own data?
We deliver it for you
We set it up on your data and your rules, load your first layers, and support it on Strata Hosted or Custom.
Delivery, licence and annual supportKeep exploring
All 9 Health apps →Explore similar apps
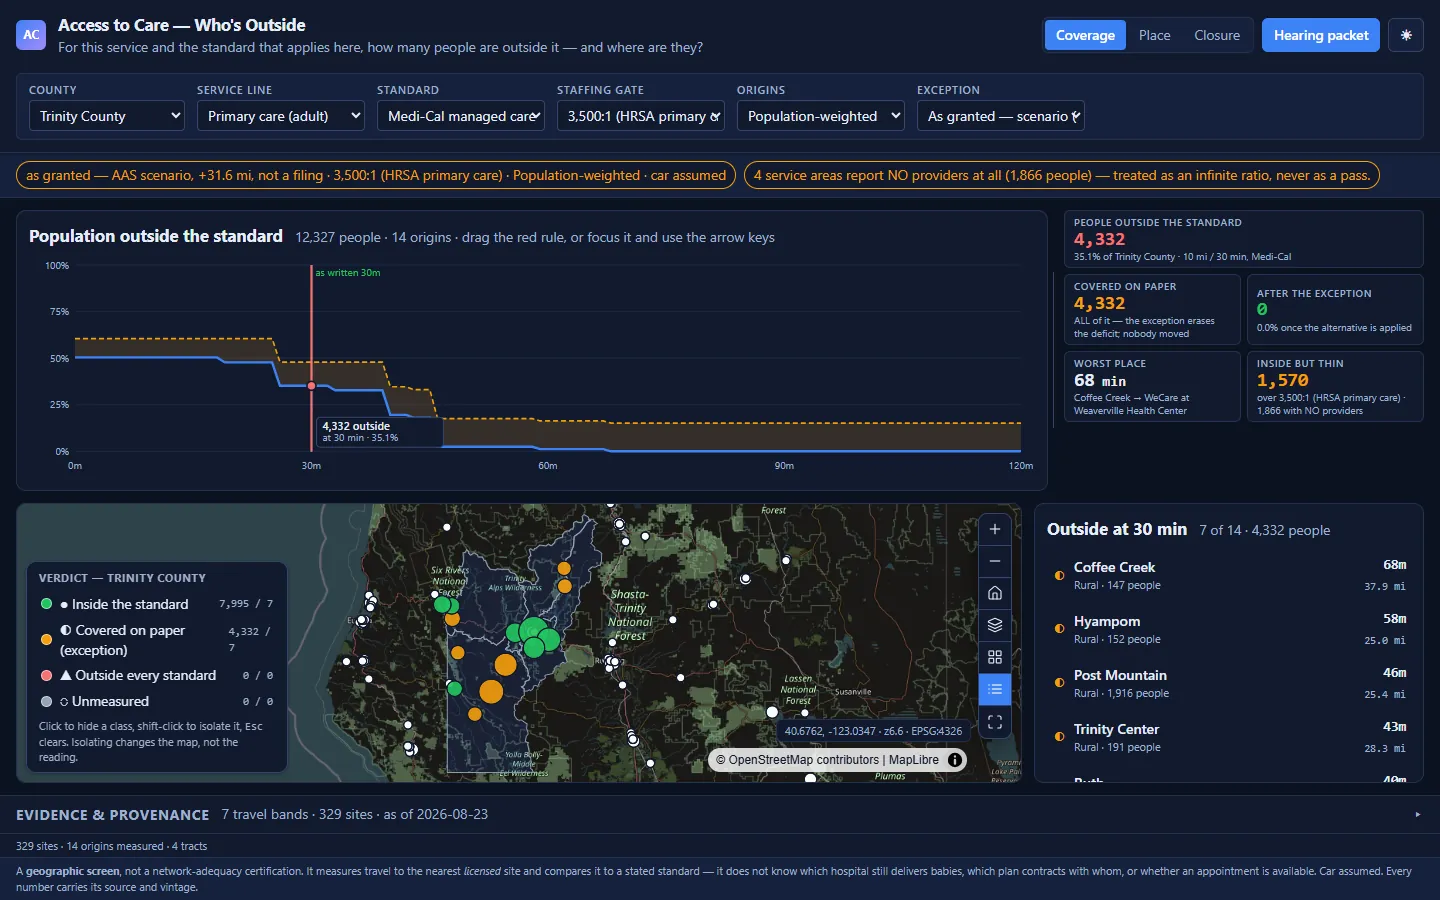
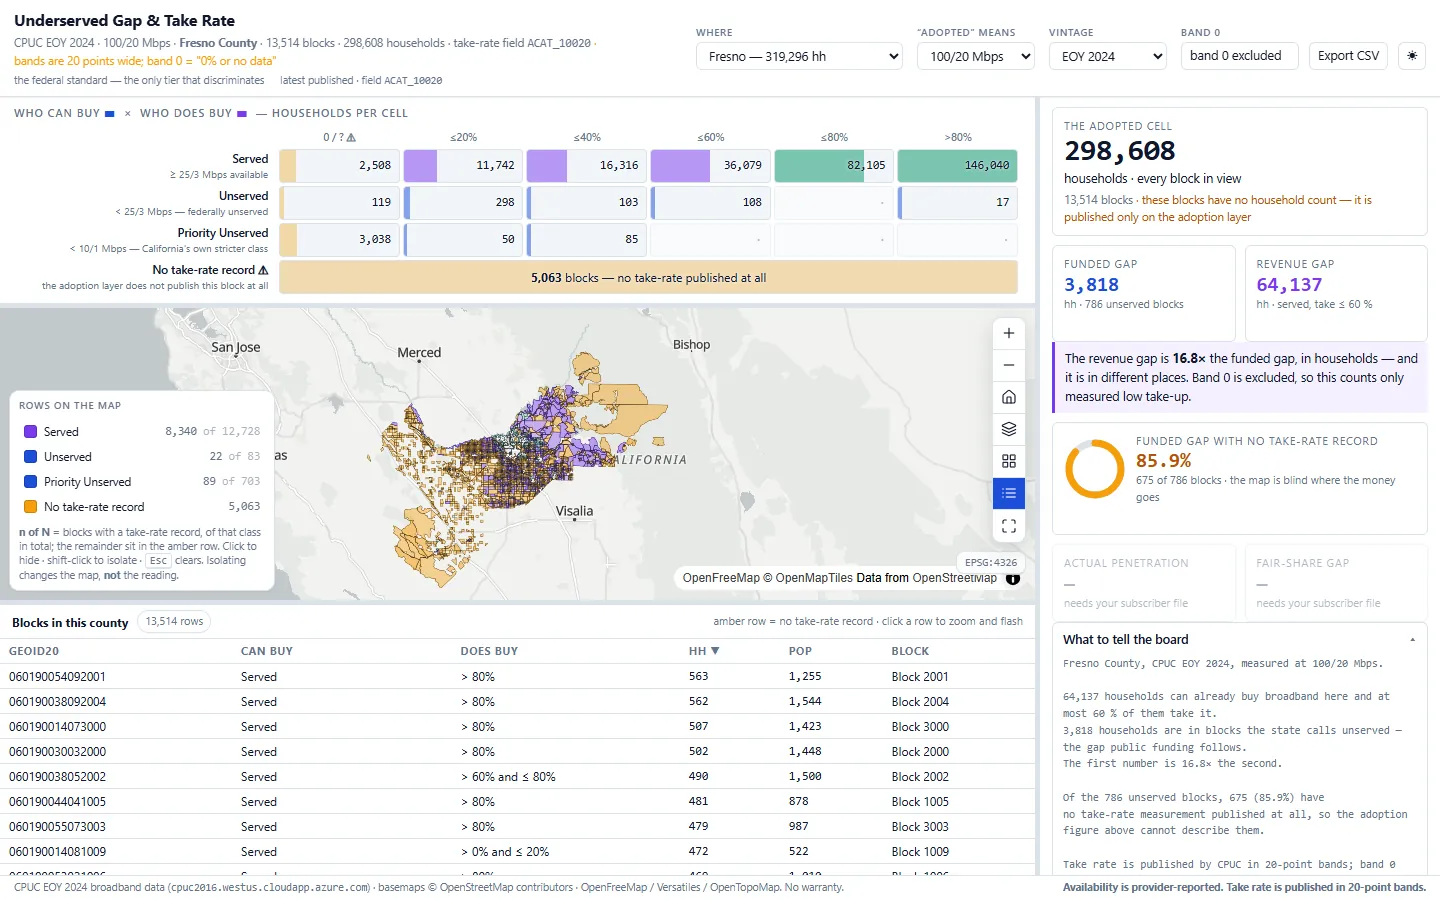
Access to CareHow many people live more than 30 minutes from a doctor?See the app →
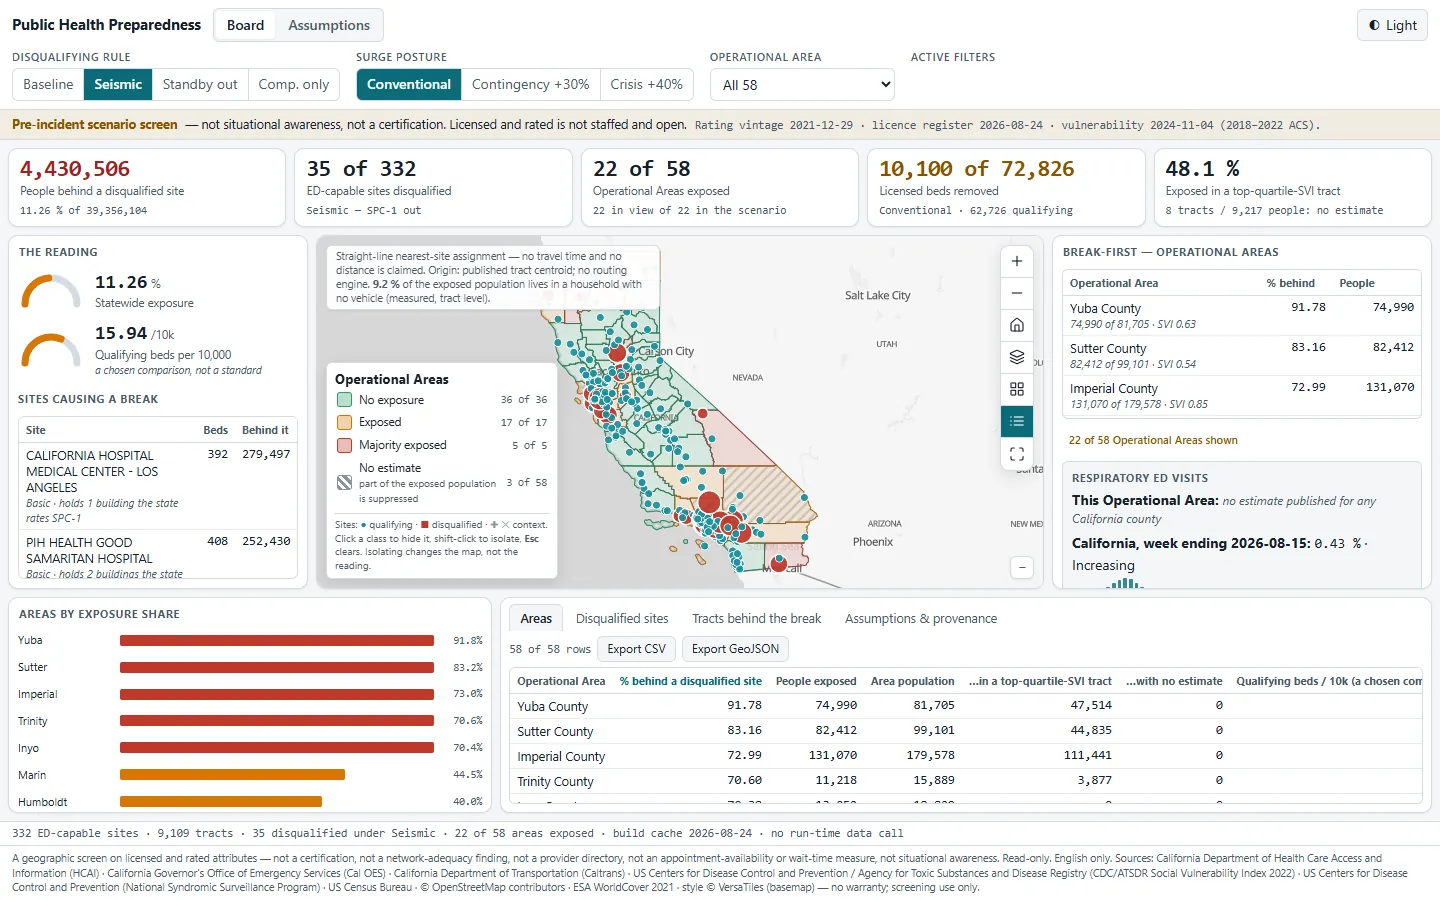
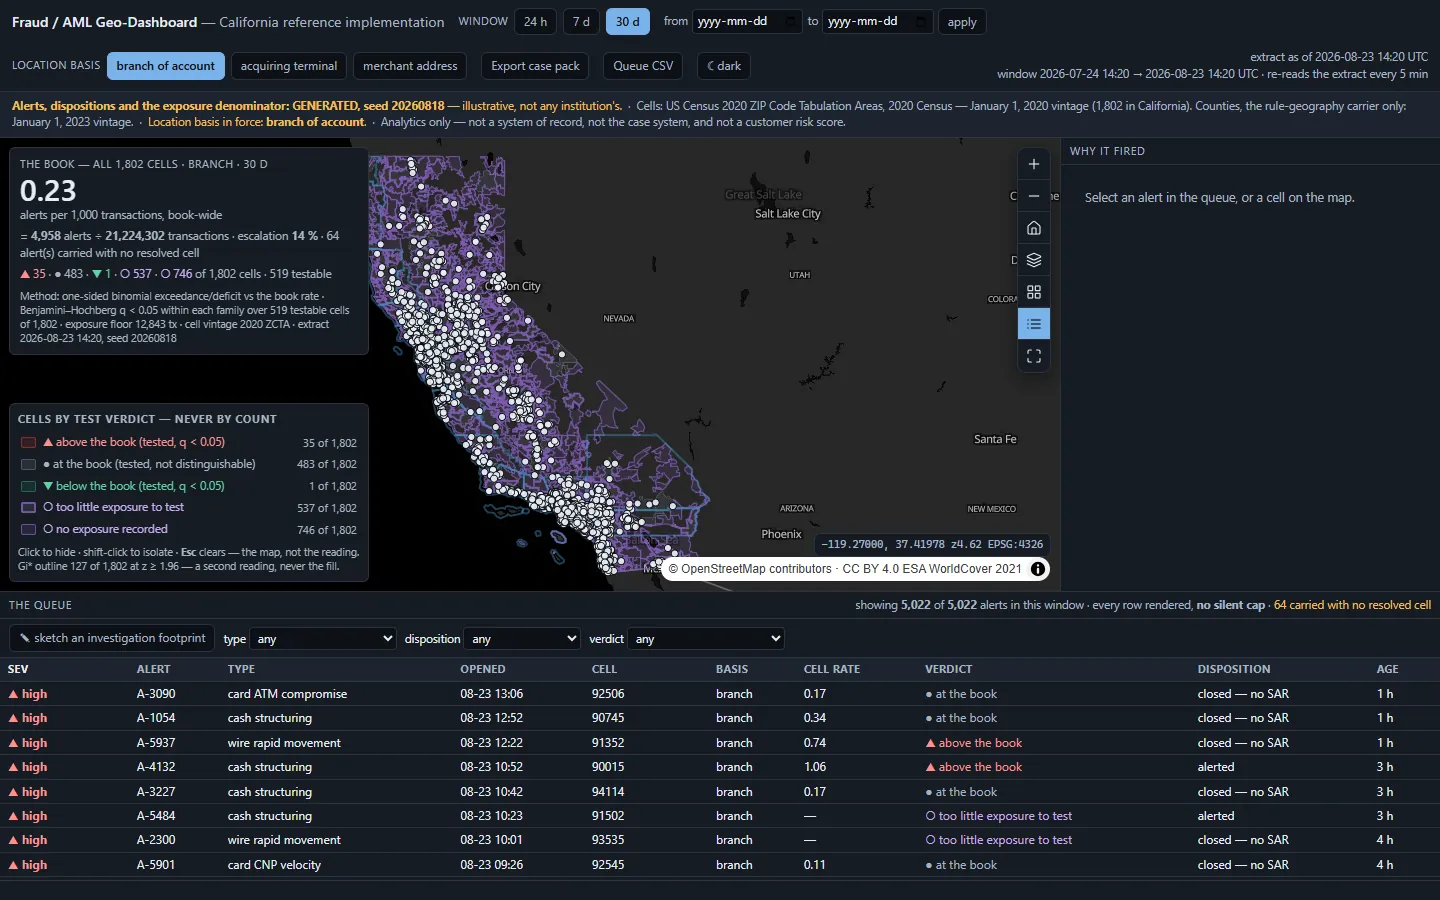
Public Health PreparednessWhere does the health system break first in a surge?See the app →
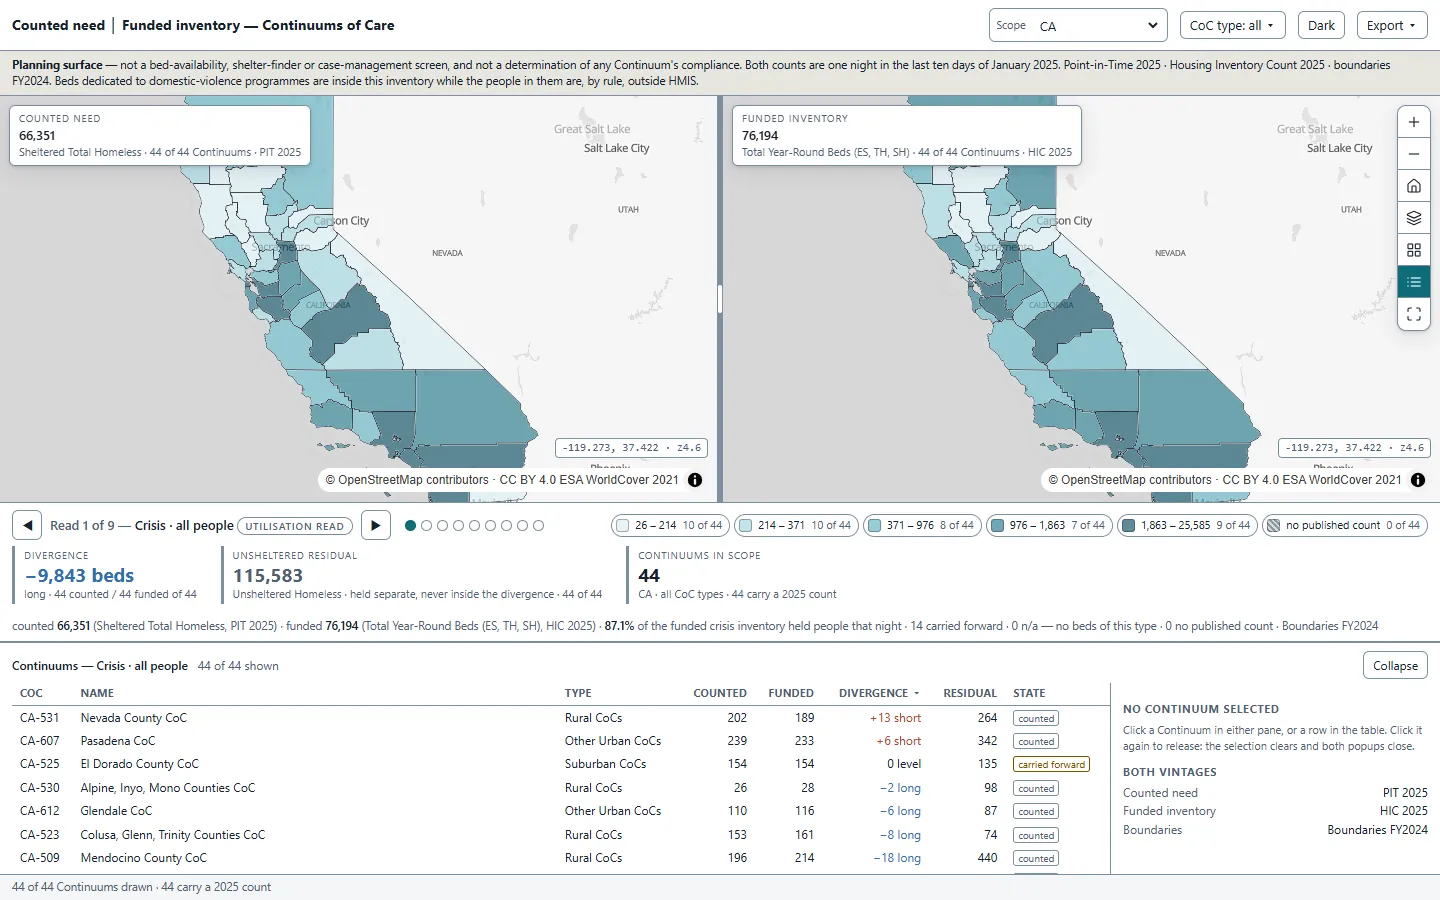
Counted Need & Funded InventoryWhere does funded capacity fall short of need?See the app →